Is Your Org Chart Fiction?
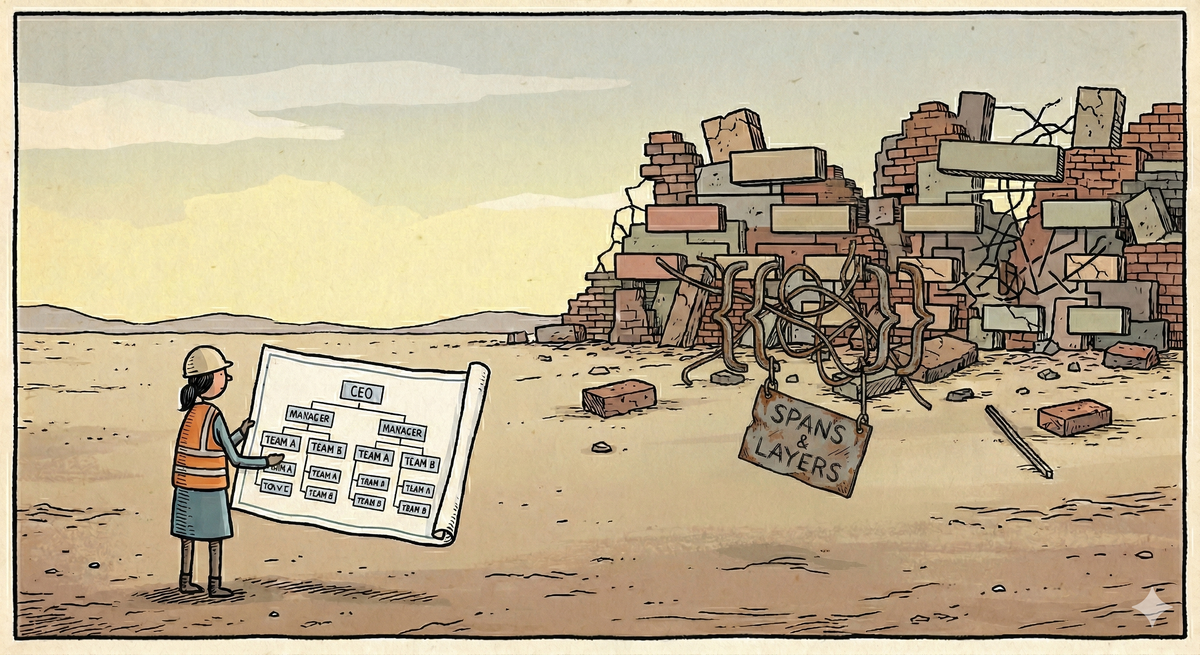
Leadership teams gather regularly around org charts like strategic artefacts. They debate reporting lines, spans of control, layers of hierarchy. And then they'll announce "transformations" with updated PowerPoints showing the new structure.
But most of these charts are lying to them. Here's the first fiction: org charts show employees. It does not show your organisation. Major outsourcing and management of suppliers that mask, even just 5% of an extended workforce, create this fiction.
Whilst this may be a different experience for me in Australia, globally, the average enterprise, 43% of the workforce isn't on that chart. The contractors embedded in your product teams. The consultants running your transformation programs. The SoW resources who've been "temporary" for three years. The agency staff who know your systems better than your employees do.
These people do work. They attend meetings. They make decisions. They have institutional knowledge. They report to your managers (functionally, if not formally). But they don't exist in the document your CEO uses to understand the company.
Your "span of control" is a lie.
That director with six direct reports? She actually manages nineteen people - six employees and thirteen contractors. Her real span of control is triple what HR thinks it is. But nobody's measuring that. Nobody's asking whether she has the capacity to manage a team of nineteen. Nobody's questioning whether the "flattening" initiative that gave her more employees actually flattened anything, or just made the invisible workforce invisible-er.
Your "lean" organisation isn't lean.
When companies boast about headcount efficiency—revenue per employee, profit per FTE—they're playing an accounting trick. They've moved labour off the headcount and onto the services budget. The work didn't disappear. The workers didn't disappear. They just disappeared from the metric.
I've seen companies trumpet their "lean" ratios while spending more on contingent labour than payroll. That's not efficiency. That's camouflage.
Your reorgs only move <70% of the pieces.
This is the one that should embarrass the transformation industry. Companies spend $50 million on restructuring programs that touch employees only. They redraw reporting lines, consolidate functions, eliminate layers and all while leaving the contractor population completely static.
The result? You've reorganised around people who might leave for a better offer, while ignoring the flexible workforce that could actually flex to your new design. The consultants who sold you the reorg didn't mention this, because acknowledging contractors would complicate their methodology.
What a real org chart would show?
Imagine an org chart that included everyone who does work for your company (employees, contractors, consultants, agency staff, gig workers( Colour-coded by classification. Sized by cost. Lined by actual reporting relationships, not just HR system hierarchies. Maybe presented in a knowledge graph? The Org raised $33M on the idea of codifying charts for example (actually I think this would have been the closest competitor to LinkedIn back int he day).
Most executives have never seen this chart. Many would be shocked by it. Some would find entire shadow hierarchies they didn't know existed—contractor teams with their own leads, managed by managers who don't appear on any official structure.
You can't design an organisation you can't see.
Until org design includes the total workforce, it's not design. It's decoration.